
David
Sunday, August 16, 2026
I Benchmarked Lambda arm64 vs x86_64 on an I/O-Bound Workload So You Don't Have To
Summarize with AI
Graviton is always pitched as cheaper. I wanted to know if it’s also faster — for a boring, I/O-bound Lambda function, not the CPU-crunching demos AWS likes to show off.
AWS says faster. I don’t do “trust me bro” benchmarks.
AWS markets Lambda on Graviton (arm64) as up to 20% cheaper and faster than x86_64 for “most workloads.” Most of the public benchmarks backing that up are CPU-bound — image compression, number crunching, that kind of thing. But most Lambda functions running in production aren’t doing math, they’re doing I/O: call DynamoDB, call S3, call some other API, then wait.
So the question I actually cared about: for a function that does exactly one thing — write 5 items and read 5 items from DynamoDB — does the CPU architecture still matter, or does network wait time drown out any hardware advantage entirely? The only way to know was to deploy both versions, same code, same region, and measure.
Scope note: everything below is Node.js only (nodejs24.x). The init/cold-start behavior of a runtime is tied to how that language boots and how its AWS SDK sets up connections — Python, Java, Go, or .NET could easily land on different numbers, especially on the cold-start side. Treat this as “here’s what I measured for Node.js,” not a universal verdict on arm64 vs x86_64.
🏗️ The setup
Four pieces: two Lambda functions that are byte-for-byte identical in code, differing only in the Architectures flag (arm64/x86_64); one on-demand DynamoDB table both of them read from and write to; and a benchmark script running locally that invokes both, then reads the results back out of CloudWatch.
MemorySize, and each invocation writes/reads DynamoDB and logs to CloudWatch. The script then polls CloudWatch for the REPORT line, retrying since log delivery isn't instant.The nice part of this setup: since both functions ship from the exact same code (packaged via SAM, differing only in the architecture flag at build time), any measured difference has to come from the hardware — not from the code being different.
🧪 The benchmark scenario
For each (architecture, memory) pair across 6 memory tiers (128/256/512/1024/1769/2048 MB) × 2 architectures = 12 combinations, the script ran:
- 20 cold invokes — forced by flipping
MemorySizeup and back down to the exact value under test. Lambda treats this as a configuration update and tears down every running instance, so the next invocation is guaranteed to cold-start a fresh container. - 100 warm invokes — called back-to-back with nothing changed, to measure steady-state performance once the container is “warm.”
async function forceColdStart(functionName, targetMemory) {
  // bump MemorySize -> any warm instance gets torn down completely
  await lambda.send(new UpdateFunctionConfigurationCommand({
    FunctionName: functionName,
    MemorySize: targetMemory + 1,
  }));
  await waitForUpdateComplete(functionName);

  // set it back to the value I actually want to test -> next invoke is guaranteed cold
  await lambda.send(new UpdateFunctionConfigurationCommand({
    FunctionName: functionName,
    MemorySize: targetMemory,
  }));
  await waitForUpdateComplete(functionName);
}
Total: 12 combinations × 120 invokes = 1,440 calls. None of the numbers come from timing inside the handler (measuring your own measurement overhead is a classic trap) — they’re all parsed from the REPORT line Lambda itself writes to CloudWatch Logs: Duration, Init Duration, Billed Duration.
One thing that bit me mid-run: CloudWatch Logs delivery isn’t instant — sometimes it lagged up to 15 seconds. The first pass came up 132 warm samples short because the script only queried the log once, immediately after invoking. Fixing it meant adding retry logic (up to 8 attempts, 2 seconds apart) and re-running two extra passes to get the full 1,440/1,440 samples.
📊 Results
Four metrics measured, and none of them tilted as hard toward one side as I expected going in.
Warm invokes: basically a tie
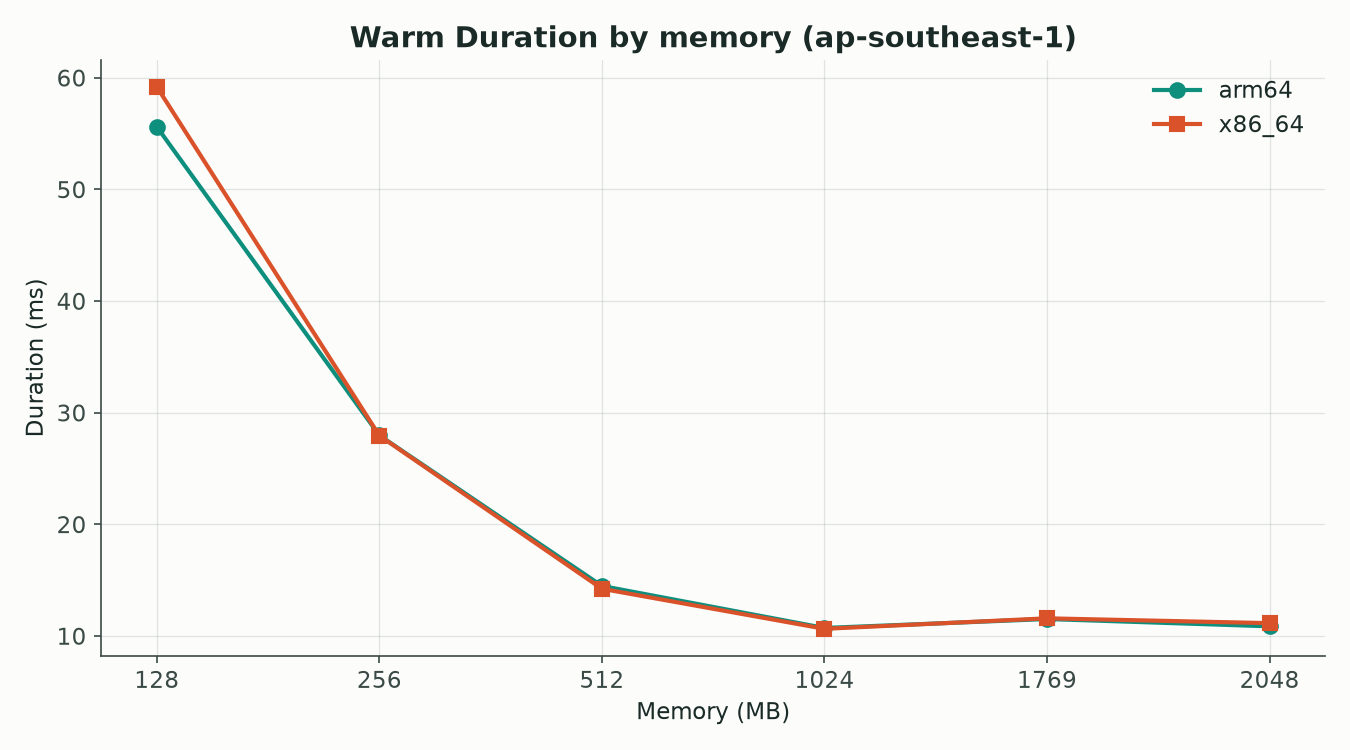
Across 1,200 warm invokes, the average gap was just 2.3%. Which tracks with the hypothesis: once most of the wall-clock time is a round trip to DynamoDB, CPU architecture barely moves the needle.
Cold invokes: a two-sided story
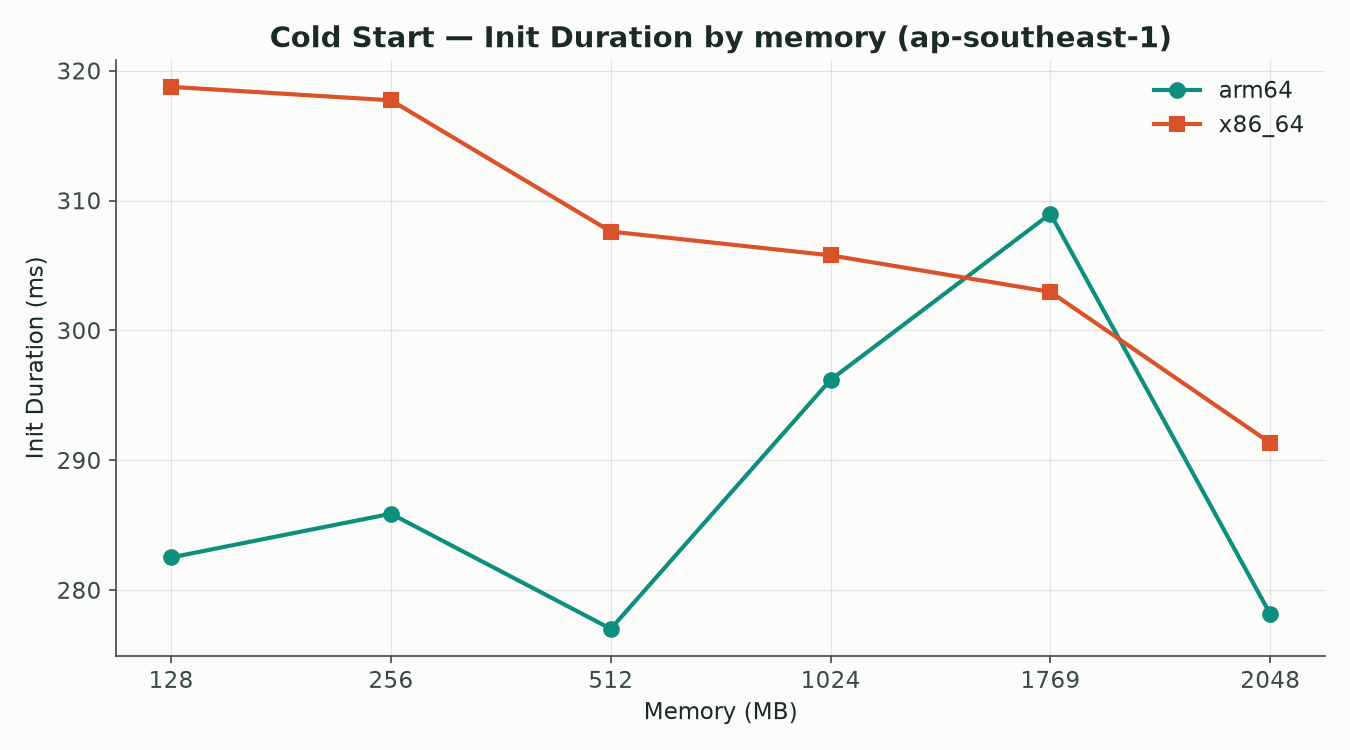
A cold invoke splits into two separate numbers in Lambda’s REPORT line: Init Duration (bootstrapping the runtime — the part that’s actually “cold start”) and Duration (time spent running your handler’s code, measured the same way it is on warm invokes).
Init Duration alone: arm64 is 6.4% faster.
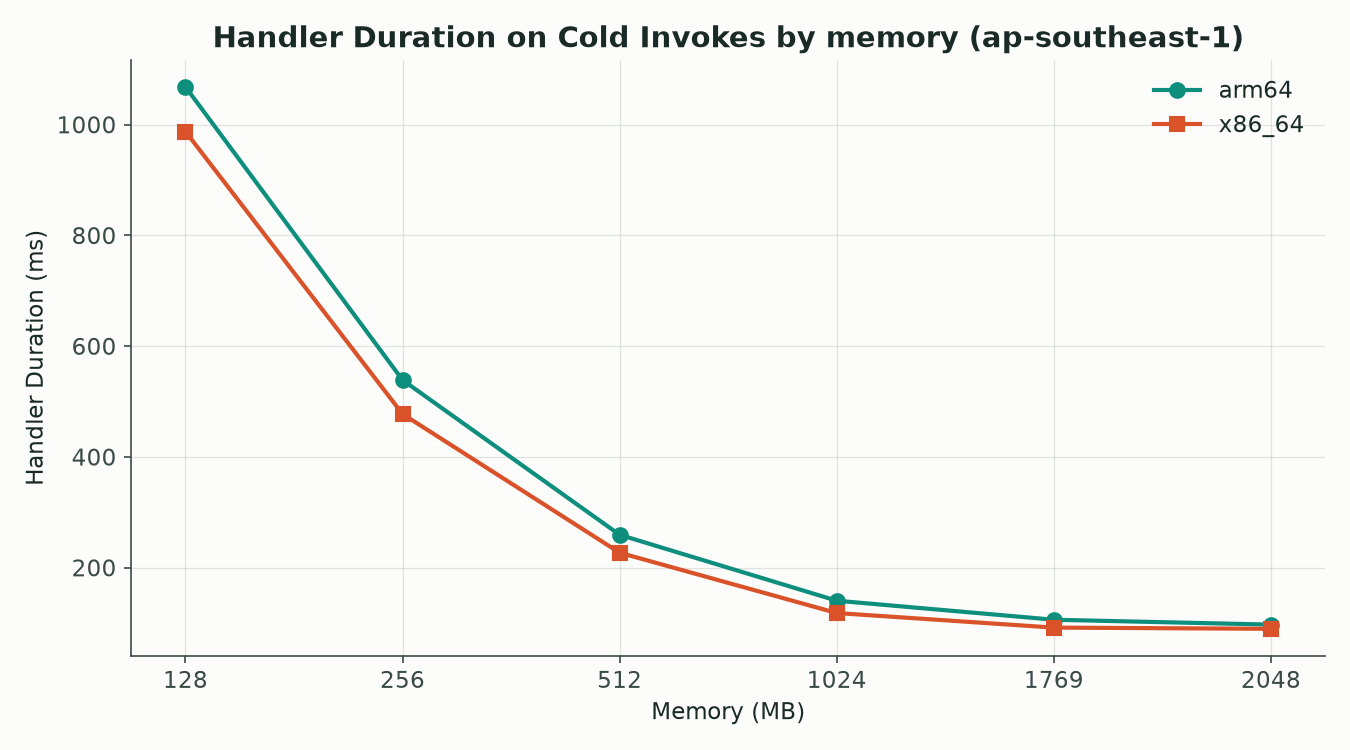
But the handler’s Duration on those same cold invokes runs slower on arm64 — losing to x86_64 across all 6 memory tiers, most likely from the cost of setting up TLS/SDK connections on that first DynamoDB call:
Add both halves together into the total latency a user actually waits through on a cold invoke:
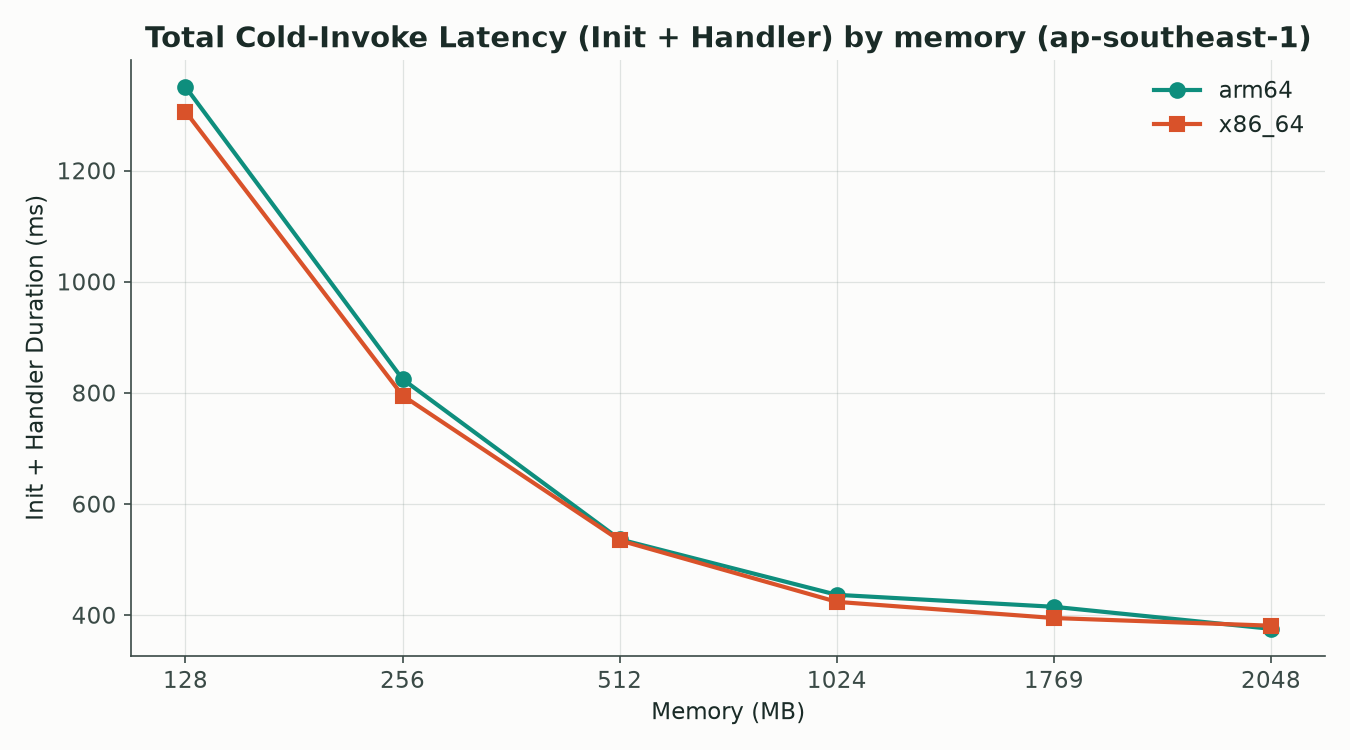
The two effects cancel each other out. Total cold-invoke time between arm64 and x86_64 shows no meaningful difference (2.3%) — a very different picture from the “arm64 cold-starts faster” impression you’d get from looking at the Init Duration chart alone.
P99: still no clear winner
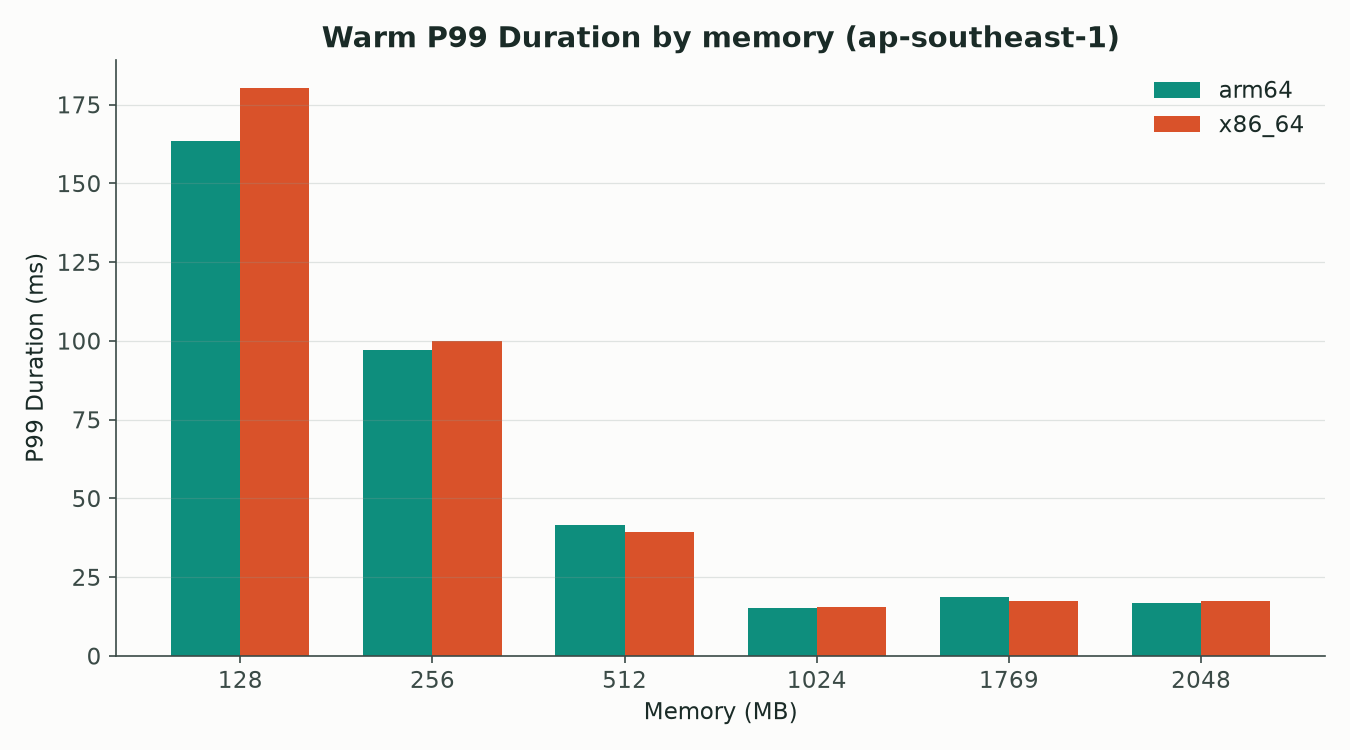
Tail latency isn’t stable enough to be a deciding factor either — whichever architecture “wins” flips depending on the memory tier.
Cost: this is where it actually diverges
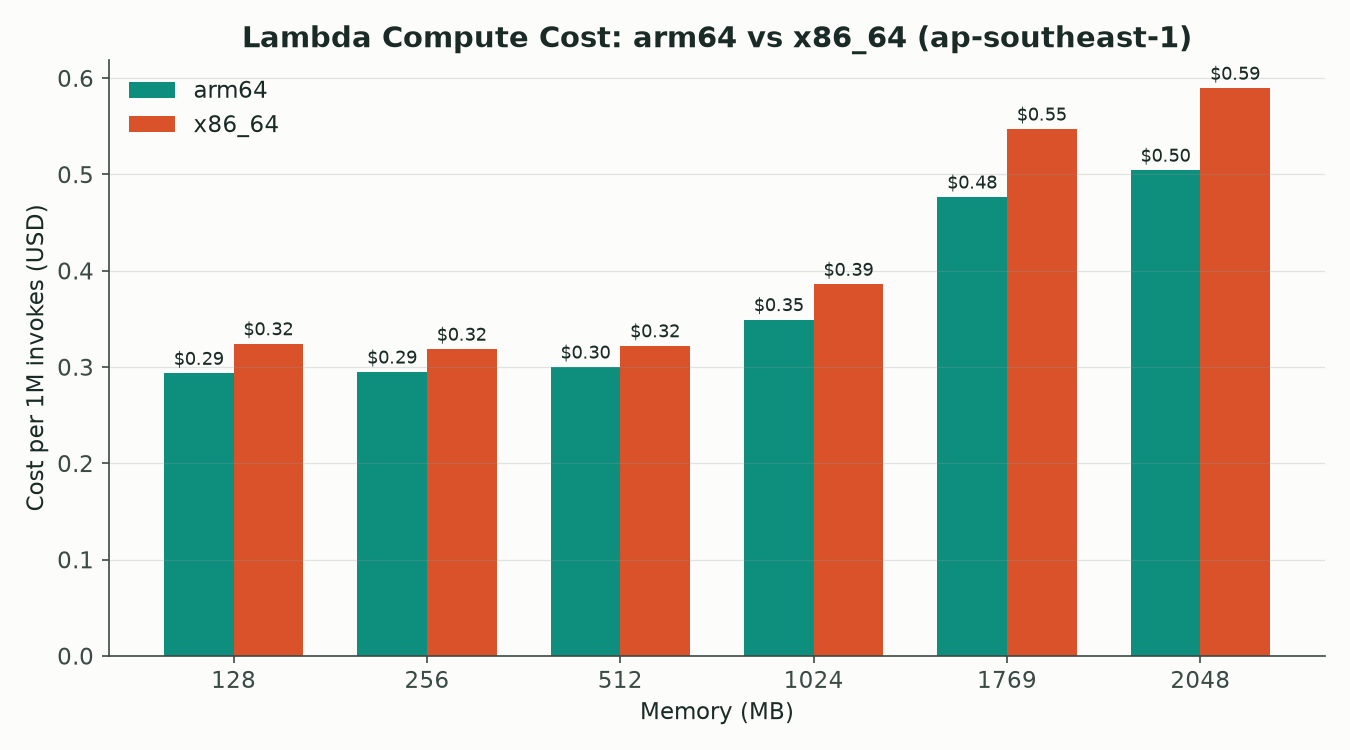
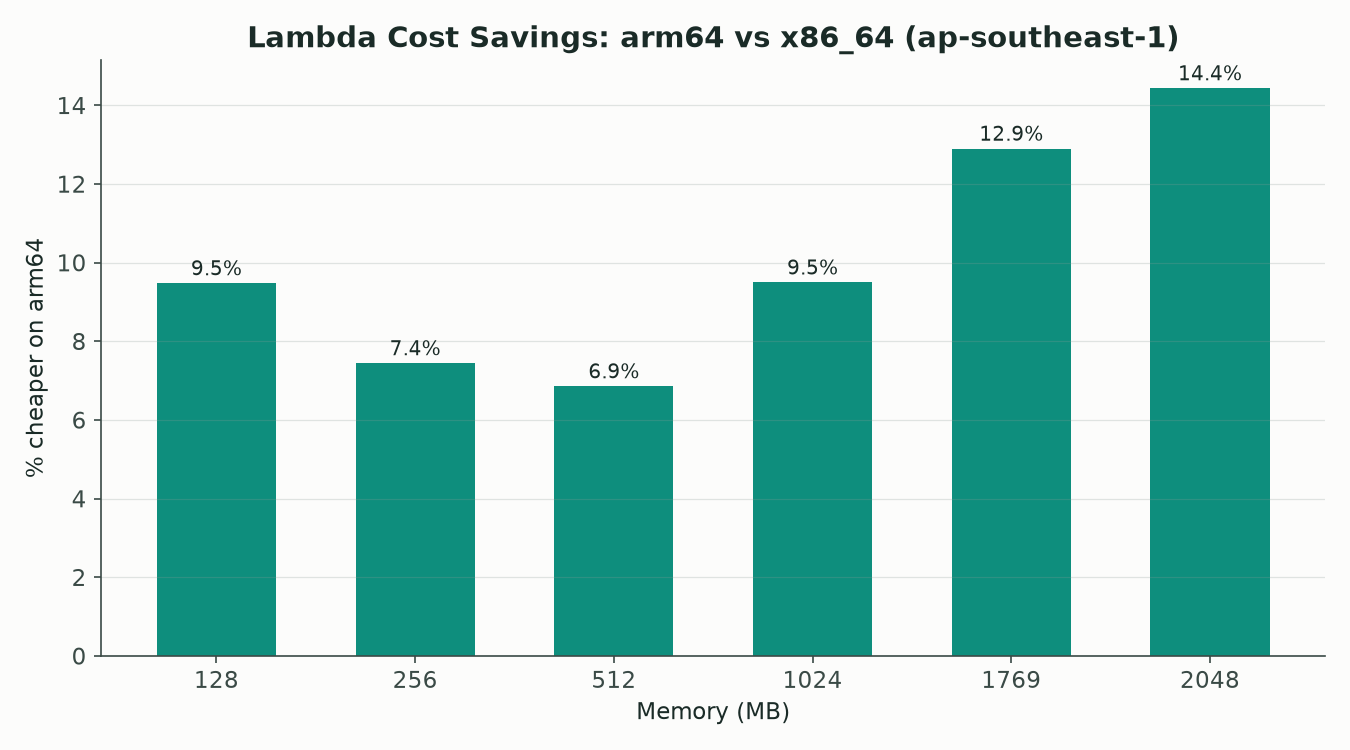
Computed from real billed duration × the actual per-GB-second price for Singapore (ap-southeast-1): arm64 comes out cheaper across all 6 memory tiers tested, from 10.1% on average up to 14.4% at 2048 MB.
💡 Conclusion
On raw performance, the two architectures are close to equivalent for this I/O-bound workload — neither one wins decisively, even though any single chart in isolation can make it look otherwise.
Compute cost is the one metric with a consistent, meaningful difference: arm64 is cheaper at every memory tier I tested.
My takeaway: default to arm64 for I/O-bound workloads like this one — the cost savings are real and you’re not trading away performance to get them. The one exception is a function pinned to a native binary or library that’s only built for x86_64.
And since this was measured on Node.js specifically, if your workload runs on a different language runtime, don’t assume the numbers transfer — the init/cold-start path differs enough by language that it’s worth re-running this on whatever runtime you’re actually shipping.
If you want to reproduce this yourself: deploy two identical functions differing only in Architectures, force cold starts by nudging MemorySize up and back down (not a redeploy), parse timing straight from the REPORT line instead of measuring inside your handler, trim outliers and look at percentiles rather than raw means, and remember to tear the stack down afterward — DynamoDB on-demand plus 1,440+ Lambda invocations adds up if you forget.